c : speed of light in vacuum
ν: speed of light in the considered medium
In this post, some basic concepts about optical fiber refractometers will be briefly explained, including their function, the different existing types and some of the main parameters that enable to characterize their performance.
A refractometer is an instrument that, as its name suggests, is used to measure the index of refraction (n), which is defined as the ratio between the speed of light in vacuum (c = 3·108 m/s) and the speed of the light in the respective medium (ν), where ν ≤ c. Here, it is important to remark that n is not constant and it varies as a function of the wavelength as well as other parameters, such as temperature or pressure. For instance, the refractive index is 1 in the case of vacuum and 1.33 in the case of water (measured at 589 nm) [1].

Measuring the refractive index (RI) of a substance may seem abstract, but it is a useful feature for identifying liquids or translucent solids. These devices are also employed to study the degree of purity of a substance or to analyze the concentration of solute dissolved in a solution based on the RI value. For this reason, refractometers are used in chemical analysis, food testing, environmental monitoring, biological detection, or medical diagnosis [2]. In one of our previous posts, the use of a refractometer to measure sugar content is described.
Within fiber optic-based refractometers, there is a great variety, including those based on periodic structures (Fiber Bragg gratings, FBGs; Long Period fiber gratings, LPGs), interferometers (Michelson, Fabry Pérot, Mach -Zehnder, Sagnac) or in a thin film deposited on the optical fiber (Surface Plasmon Resonances, SPR; Lossy Mode Resonances, LMR) [1].
For the sake of simplicity, it can be said that the output response of the refractometers mentioned in the previous paragraph can be plotted as a function of optical power versus wavelength. Here, there is a certain wavelength value (λ) in which the power drops to a minimum. The position of λ is correlated with the RI value of the medium surrounding the fiber optic arrangement, so if λ value is known, RI can be deduced from it.
In order to compare adequately refractometers based on different phenomena it is important to define some quality parameters, some of which are described below:
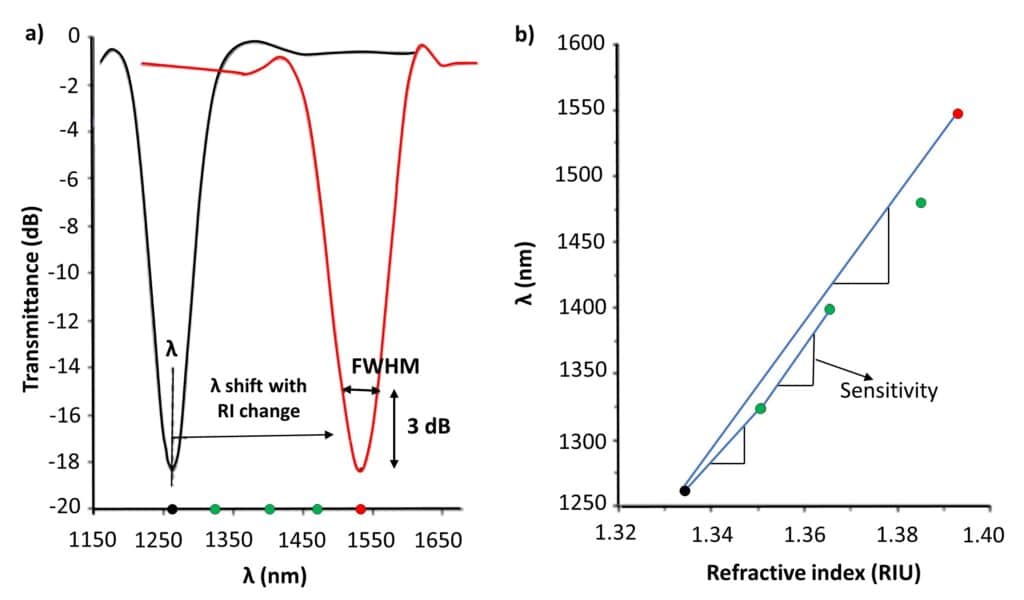
- Sensitivity: ratio between the wavelength shift and the external RI variation. It is measured in nm/RIU (nanometers per Refractive Index Unit). Here, it must be noted that the sensitivity of a refractometer is not constant and varies depending on the range of RI which is used when calculating the ratio.
- Full Width at Half Maximum (FWHM): wavelength range around the minimum power wavelength where the power is 3 dB above the minimum. Obviously, the smaller the width, the more accurate the refractometer.
- Figure of merit (FOM): ratio between the sensitivity and the FWHM (it condenses the 2 previous parameters). It is therefore measured in RIU-1. As it can be deduced, the FOM is a good indicator of how good / bad a refractometer is, because if the sensitivity is high and the FWHM is small (values that are indicative of a good performance refractometer); the FOM will be high.
- Working range: the working range determines the RI range in which the refractometer is functional
Finally, it should be said that refractometers can also be exploited as chemical sensors, biosensors or environmental sensors. This is possible because with the corresponding treatment, modification or functionalization of the initial refractometer, the change of a parameter of interest (such as Hg concentration, protein concentration, or relative humidity variation) can be linked to a change of the refractive index and therefore, to a wavelength shift, which allows to characterize the sensor. Once this characterization is carried out, knowing the value of λ will immediately enable to know the value of the parameter of interest.
Written by J.J. Imas
Bibliography
[1] Refractive index of water. Values from different sources.